Mobile website access analysis 2016
desktop v mobile
by Iain Wilson

It's nearly a year since Google's Mobilegeddon - where Google indicated they would look more favourably on websites they considered 'mobile-friendly'.
The world's going mobile and there are plenty studies to prove it.
According to a report from Smart Insights, in 2015 mobile Internet usage finally overtook desktop usage.
Also, sites that didn't get themselves mobile friendly on average were seeing a 12% drop in traffic.
This was based on US data, so we thought it might be useful to do a little investigation of our own customers. So we collected data from Google Analytics, put them in a spreadsheet and crunched out some stats and graphs.
Turns out that the visitors who visit our clients' websites still favour the desktop. But when we split the viewing figures into different types of business/activity, some categories are much more into mobile access than others.
Overall access methods
Take a look at Figure 1 above. This represents the methods people use to access the websites of our clients. As you can see 34% of accesses were made with a mobile or smart device. The majority of vistors (66%) were still using a desktop device.
Quite different from the rates being quoted in many of these reports.
Mobile breakdown by business type
Obviously, different types of business have different types of visitors, so we decided to break down the mobile access figures into business types. So we grouped clients into different categories then has a look at what the mobile access looked like then (see Figure 2).

Things start to look a little bit more like the reports now. General commercial (businesses promoting themselves online or ecommerce) and Charities are getting mobile access at almost 40%.
But look at Technical businesses (commercial but in a specialist technical or scientific area), Finance and Artistic. Their customers show very little interest in mobile access.
The group of Entertainment (restaurants, sports, music, pastimes) is the only one which is showing mobile access greater than desktop.
Which mobile?
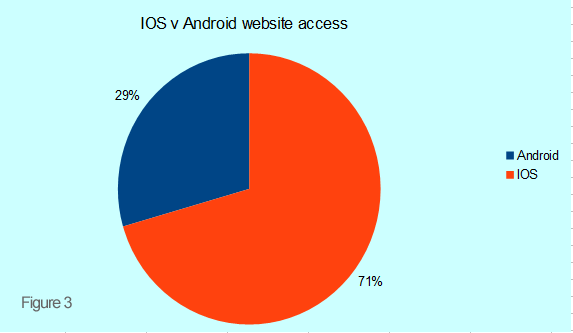
Worldwide Android mobiles hold the majority share by far (>70% apparently).
So we checked to see which mobile devices our clients' visitors were using (Figure 3).
IOS (iPhones and iPads) wins significantly. Over 70% of website access to our clients' sites was with an Apple device.
What does it all mean?
Mark Twain said, "Facts are stubborn things, but statistics are pliable", and it can certainly be easy to get them to say what you want.
We should remember that this is taken from a relativley small sample.
We should also remember the Blot Design client demographic - they are mostly established SME businesses run by experienced owners and their visitors are often similar.
They are (mostly) not young hipster dudes with the latest cool stuff and an inbuilt mobile phone plugged into their arm.
And we've also divided companies into our own arbitrarily dreamt up categories.
Having said that, there are a few pointers that business and website owners can take from these stats.
- Google's Mobilegeddon didn't really happen, but sites that have not converted to mobile friendly have lost traffic.
- Website mobile access is increasing, but in this country it may not be quite at the level it is in others.
- The type of industry you are in will make a difference to how much mobile access your website gets.
- If your business website is getting more than 20% mobile access and you've not developed it to make it device responsive, it might start to cost you soon.
So get the analytics out and check what's going on.
Liked this article? Please share it with your friends and colleagues.
